


by Jesse Reyes
The industry performance statistics for the US private equity for Q3 of 2013 have been available from Burgiss’ Private IQ market intelligence system for about a month. Rather than rush to press with the latest and greatest news, I’ve spent some time doing a deep dive on what the latest set of numbers mean for the industry. We will spend a bit of time over the next few posts analyzing the industry’s track record and putting these results in perspective.
2013 Q3 Results
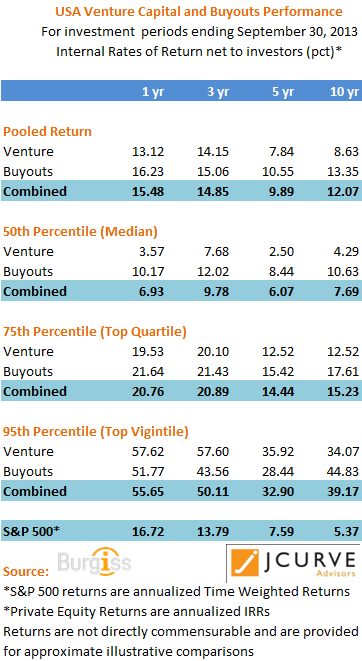
As a first look — here are the top line numbers portrayed as investment horizon returns for the 1 year, 3 year, 5 year, and 10 year periods ending September 30, 2013.
This includes US focused Venture and Buyout Funds and excludes fund of funds, mezzanine, special situation and distressed funds. The third line “combined” is the portfolio of the venture and buyout funds described above. Returns are calculated as point to point internal rates of return to limited partners net of fees and carried interest fees.
The source of this data is Burgiss’ PrivateIQ performance measurement platform which uses data from it’s limited partner and other clients to create performance data and intelligence. Data is in the form of cash flows dated as of the actual transaction date plus quarterly net asset values. It does not include OPRA/FOIA self-reported returns but calculates returns from original sources.
There are four statistical sections. The first is the pooled or portfolio return which takes the portfolio of funds in the category and calculates the rate of return as if those funds were all in one portfolio. Rather than calculating individual rates of return and averaging them which can produce some distorted results. The second section is the median fund return and the third section provides the top quartile fund results and the fourth section provides the results to the 95th percentile — yes there is a mathematical term for that–“top vigintile”
In addition S&P 500 stock index results are provided for the same investment periods for context. Please note that public market results are not directly comparable to private market results because of the difference in calculation methods but are provided for illustrative comparison.
Half a decade later — any signs of recovery?
By now funds should be past the two biggest financial downturns in the industry. I forecasted in the early 2000s that it could take the venture industry a decade or more to come out of the dot.com collapse. However the almost-apocalypse of 2008 provided an additional challenge to both venture and buyout funds deferring full recovery.
It can be demonstrated that both asset classes were impacted in both the short and long term by the financial crisis by examining three-year and five-year results which span the time periods after the financial meltdown. Remember that by 9/30/2013, we are exactly five years from the 2008 Q3 collapse of Lehman and resultant financial chaos.
Since that event, the venture industry has returned almost 8 percent to investors and the buyouts industry has returned 10.5 percent on a pooled portfolio basis.
Even on a median basis the buyouts industry has been able to return low double digit returns over the last three years and in the prior 12 months which continues to bode well for the industry. However median single digit venture returns across all time periods is but one factor in the challenging fundraising market.
Bifurcated Fundraising — Percentiles are one key.
There are two fundraising stories in the industry. There are still funds that have a relatively “easy” fundraising cycle but by no means the fait accompli of the 1990s. However venture capital continues to find an extremely challenging environment in which to raise capital as many investors have rolled back their allocations or are just not compelled by the intermediate-term venture track record.As a result Limited Partners have been on a “flight to quality” for the better part of the last decade making it extremely difficult for even “top quartile” funds to easily raise capital.
However the ubiquitous top quartile fund (75th percentile) results have increased materially over the last 3 to 5 years with performance even in the last 12 months significantly higher than the public markets which is the reason why the venture industry still have some fans.
Climbing Everest
In the aforementioned “flight to quality”, Limited Partners continue to try to find those elusive funds with significant outperformance.
In any statistical data set the maximums are usually marked by extreme outliers which results in long tail distributions. The 95th percentile –which is termed mathematically the top “vigintile” provides a reasonable boundary for the “maximum”.
The results for this rarified set of funds — probably no more than 30 to 50 funds in their respective sub-asset class categories represent the results that LPs drool over. Make no mistake some investors ARE getting these results as these funds do have investors. These are usually the funds that are often oversubscribed and may have waiting lists of investors outside their doors so are difficult to access.
These overview results are a just a preliminary step in understanding how the private equity industry was affected by, and how it is recovering from, the financial maelstrom of the last five years.
Next in the series: “Recovery after the Financial Crisis – how is the private equity industry faring”
For more information about Burgiss and their benchmarking and performance decision support system platform PrivateIQ see www.burgiss.com.
As for me, feel free to leave me a comment below or send me an email at jesse.reyes at j-curve dot com.