


There have been numerous headlines heralding the venture capital industry’s comeback after the long decade post-internet boom and bust. Others have been skeptical and opine that venture capital’s glory years are long behind it and while we continue to have more IPO exits and home-run technology investments, the industry is but a shadow of itself.
We now have the data to examine whether the industry is in real recovery. In this post we’ll use the data from the Burgiss Private iQ system to examine the case for recovery. In the next post, we’ll examine some factors which might throw a bit of a shadow on that conclusion.
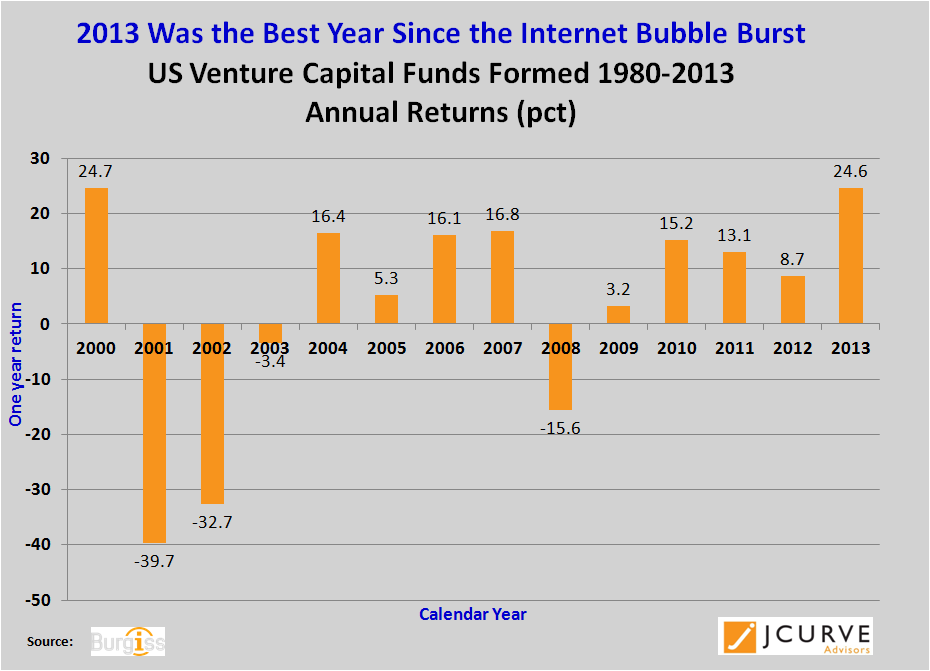
According to the data from the Private IQ platform, Venture Capital returns for the year ending 12/31/2013 were 24.6% which is the largest one-year return since 2000 when the venture capital industry started it’s correction from its 1999 peak of +316% . It’s also the first time since that 2000 that returns were above 20%. That is a significant milestone given that much of the decade-and-a-half since that 1999 peak has been marked by annual mediocre to negative returns.
The question we are going to examine is:
Are these returns real?
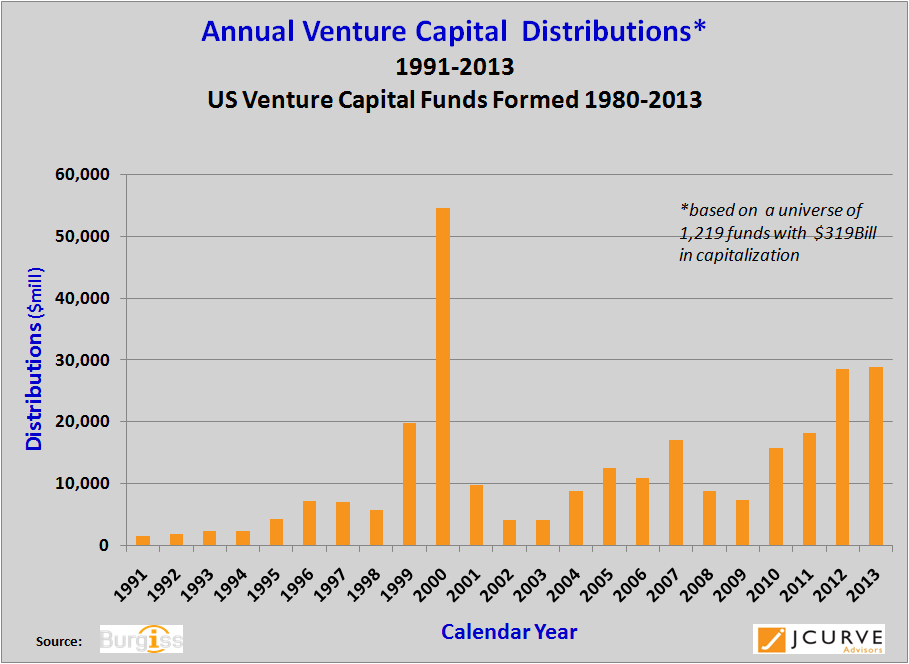
Evidence that these returns are “real” lies in the fact that according to the data, recent returns are driven by distributions to limited partners rather then simple increases in unrealized value. Actual distributions for this data set demonstrate that distributions in 2012 and 2013 were at levels that are only eclipsed by the aberrational year 2000. The distribution levels in the past two years are unprecedented in absolute value except for that extraordinary year
A need for another measure based on commitments.
As robust as these results are, another measure is needed to put these distributions in perspectives. Traditional performance measures have focused on returns measured on the basis of paid-in capital, which ignore the significant amount of uncalled capital.
What is needed is a way to compare distributions to committed capital. There are several ways this could be done but the problem is a bit complicated to construct and interpret as commitments are made at one point in time while contributions and distributions from those commitments occur over subsequent time periods.
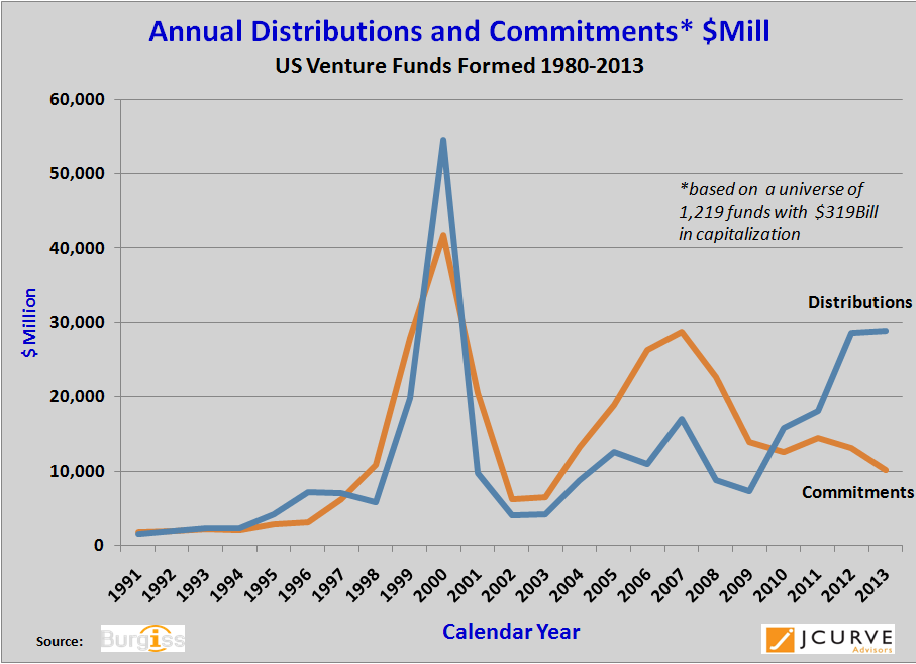
One way would be to compare total cumulative distributions since-inception to total cumulative committed capital since-inception as is done with DPI/RPVI/TVPI realization ratios. However this puts a lot of weight on events too far in the past to provide relevant current information.
Thus we propose comparing distributions to some measure of trailing commitments. One example would be to compare distribution to trailing commitments. The trick is determining a reasonable trailing period. By experience, eight years seems to be a reasonable trailing period as we’ve used that time period with some success to estimate AUM from trailing eight-year commitments.
Using trailing periods we can construct two measures:
- Annual distributions to trailing eight years of commitments. This provides a short-term measure of most recent distributions compared to longer term commitments. We will call this ratio DCC8.
- Trailing eight years of distributions to trailing eight years of commitments. This provides a long-term distribution to long-term commitment measure which should smooth out aberrations. we will call this ratio D8CC8.
Short-Term Distributions
One way of putting distributions into perspective is to compare short term distributions to long-term commitments. In this case we compare annual distributions to trailing eight-year commitments.
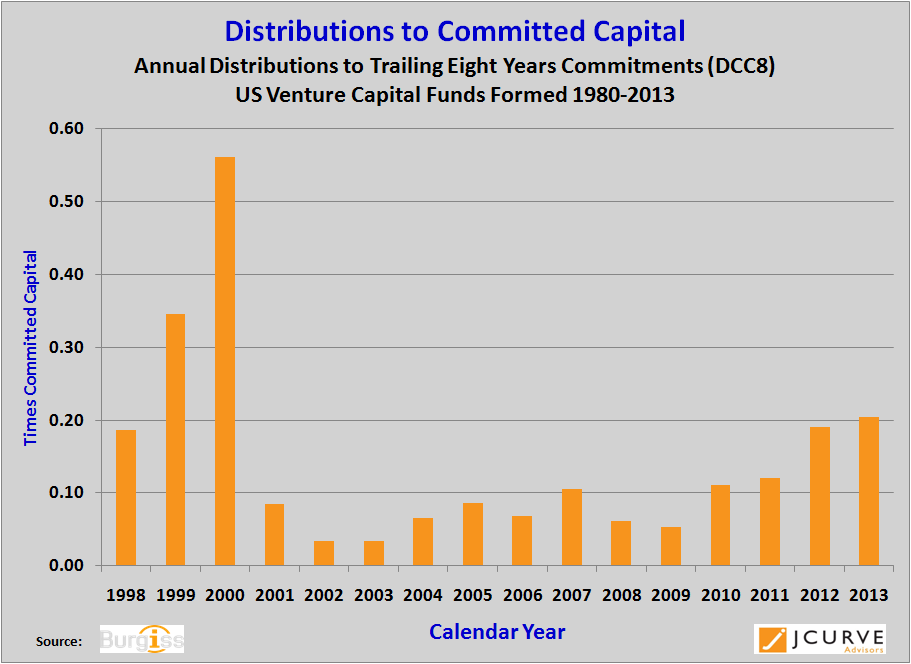 This chart resembles the normative distributions in figure 2. But it does validate the distribution trends we’ve observed. Based on this measure, 2013 (as well as 2012) had the most significant increases in distribution to trailing commitments since the peak of the internet bubble in 2000. Distributions in 2013 were 20% of total commitments from 2006 to the present. This is further evidence that that recent returns are driven by realizations, not simply valuation appreciation.
Long-Term Distributions
Another view is to compare long term distributions to long term commitments by comparing eight-year trailing distributions to eight-year trailing commitments.
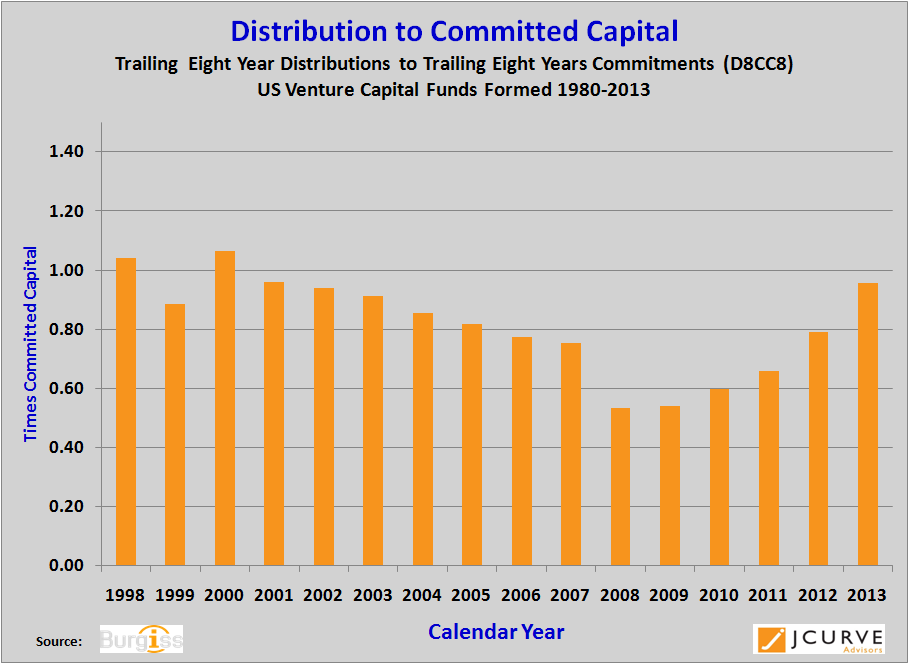 By examining long term distributions as a percentage of long term commitments, it can be demonstrated that venture funds have continued to increase their distributions at a faster pace than new commitments since 2008’s financial crisis. We are now at 2000/2001 levels.
Conclusions
This analysis does seem to validate that venture capital returns in recent years are the result of distributions rather than valuation appreciation.
In our next post, we’ll examine whether how these returns compare to the public markets and other private equity funds.